If you’re looking for a tried-and-true method to increase your profits in futures trading, then technical analysis is the right choice. Technical analysis looks at price patterns and trends over time to identify potential entry and exit points which can provide profitable trade opportunities.
This article will outline the basics of technical analysis, including charting techniques and indicators like Moving Averages, Bollinger Bands, and Relative Strength Indexes (RSI). We’ll also cover how these tools can be used to make informed predictions about pricing movements to potentially maximise your gains from future trades. So, if you’re eager to utilise this powerful analytical approach, read on.
Overview of Technical Analysis and Benefits of Using it for Futures Trading
So, what are futures in trading? Futures trading is an instrumental aspect of investment for numerous traders. It is a form of financial transaction that allows investors to purchase or sell particular assets at a specific time and price. However, with several changes occurring in the market, traders must adopt versatile techniques to get ahead. One such method is technical analysis.
Technical analysis involves studying market behaviour, trends or patterns and charting to predict future market movements. Technical analysis can help futures traders make informed decisions, manage risk and gain an edge over other traders. By analysing different types of data, technical analysis can provide a practical advantage for traders in an often volatile market.
Types of Charts Used in Technical Analysis
Charts are the primary tool used in technical analysis. They visually represent past and current market data, which traders can use to observe patterns and trends over time. Here are some of the most commonly used charts in technical analysis.
A line chart is one of the simplest yet effective charts for beginners. It shows the closing price of an asset over a specific period as a continuous line. It helps to see the overall trend of an asset and identify potential support and resistance levels.
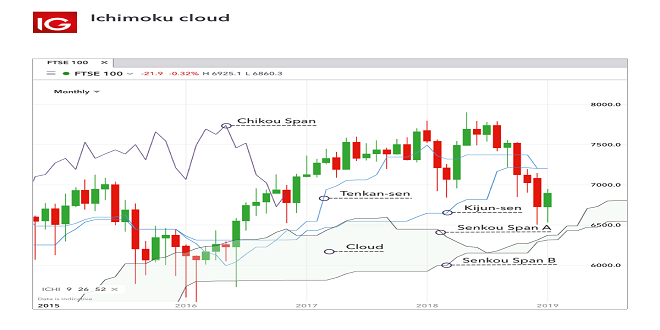
Candlestick charts are another popular type of chart used in technical analysis. They provide more detailed information than line charts, showing each period’s opening, closing, and high and low prices. Traders can use different candlestick patterns to identify potential market trends and reversals.
Lastly, bar charts show the same information as candlestick charts but in a more straightforward format. They use vertical lines to represent price ranges, with the top line indicating the high and the bottom indicating the low for each period.
Commonly Used Indicators and How to Interpret them
Indicators are another critical component of technical analysis. They help traders identify potential entry and exit points by analysing market data and providing signals. Here are three commonly used indicators in futures trading.
Moving Averages (MAs) are among the most popular indicators traders use. They smooth out price fluctuation over time, making it easier to identify trends. Simple Moving Average (SMA) and Exponential Moving Average (EMA) are the most commonly used MAs.
Bollinger Bands use a combination of moving averages and standard deviations to show volatility levels in an asset. They consist of three lines – the middle line is usually an MA, while the upper and lower bands represent two standard deviations from the middle line.
Relative Strength Indexes (RSIs) measure the speed and change of price movements to indicate whether an asset is overbought or oversold. An RSI value above 70 suggests an overbought market, while a value below 30 indicates an oversold market.
Advanced Strategies to Increase Your Edge in the Market
While these tools are helpful, combining them can lead to even more effective strategies. For example, traders may use a combination of moving averages and Bollinger Bands to identify potential breakouts or reversals in the market. Additionally, monitoring RSI values and basic chart patterns can provide valuable insights into market sentiment.
It’s important to note that technical analysis is not a fool-proof method and cannot predict the future with 100% accuracy. However, by using these tools and strategies, traders can gain an edge in the market and potentially increase their profits.
Implementing Technical Analysis into a Trading Plan
To utilise technical analysis effectively, traders must have a trading plan. It includes setting straightforward entry and exit points based on market data and indicators and implementing risk management strategies.
Additionally, traders should continuously monitor charts and indicators to stay updated on market trends and potential opportunities. By incorporating technical analysis into their trading plan, traders can make more informed decisions and potentially improve their success in futures trading.
 Pagalmusiq.com Popular News Update Website | Pagalmusiq.com


